Posted in : Applications, Azure, Azure, DevOps, Security Av xenit Översätt med Google ⟶
3 years ago
Doubling Datadog as a test suite
This is a small post on a development strategy that I stumbled upon recently. I have come to realize that datadog can double as a pretty decent test suite.
According to test driven development one should write tests. That’s what we have all been told, right? 100% coverage or no merge. I am being somewhat facetious here, people that practice test driven development know that you have to be sophisticated about your tests and that 100% test coverage does not really say too much. However, from what I’ve learned in school one might easily draw the conclusion that every single thing should have been completely tested once a pull request is opened. While this would be wonderful this easily breaks down once your application has to interact with external services. Thus, you basically end up with three choices:
- Mock or stub your dependency. This means including something that has the same interface, but works differently than your actual dependency. It has its uses, but you won’t really test how the application actually behaves once it runs with the real dependency.
- Include the external dependency in you test suite. For example, if you need Postgres as a dependency, include a container image and start that in your test suite. This also has its uses, but now you have to synchronize schemas between environments.
- Move your testing outside of your test suite and test things in some staging environment. Hint hint, this is where you could use Datadog.
In my situation I had a staging environment available, but was constrained under a lack of time. Therefore option 3 seemed perfect for me.
Before we dive into how this would work let’s briefly dive into observability.
Observability

The concept of observability is all the rage these days. Why would it not be? As workloads have spread across machines and moved into the cloud, the network stack has essentially been introduced into every application.
This makes the answering the question ”How is our system doing?” non trivial. A recent configuration in a firewall might drop some DNS traffic leading to some part of an application behaving just slightly off. The error states of your system keeps on multiplying as it grows in complexity. If you use cloud services you can not even log into the machine running the service to get a feeling for how things are going. Basically, your system is just a few dropped packets away from catastrophy.
Thus, every modern developer worth its salt should at least have heard of the so called Pillars of Observability.
The Pillars of Observability
Most people are well aware of logs. In fact, it’s probably the first thing you do writing an application. Even a Hello, World! is technically logging. Metrics is a collection of related data points that can be used to say something about the state of an application. E.g. for a web application it could be the number of HTTP-requests, or perhaps even more importantly, the number of HTTP-requests that did not go well. Finally, tracing is linking various ”happenings” known as spans across services. E.g. a span could be the entire life time of one http-request. Another span could be the entire lifetime of an sql query. If your sql query happened because of the http request and you link them together you have a trace!
In a modern stack it is commonplace to rely on these three mechanisms to get a grip of how your application is doing. Even more importantly, the trinity of observability helps you quickly track down issues once they arise.
Enter datadog
Datadog is probably most well known for being an observability platform, providing a way to explore and manage the three observability pillars discussed above. However, they have so many more features. In fact datadog is a black hole of features, however in a good way. This means that if you have not implemented e.g. tracing properly in your application’s, there is a very good chance that you can find some menu in datadog that will help you when your databases are burning up. It would seem that they have talked to a lot of operations people in order to figure out what one needs to keep complex systems up an running!
However, the two features that we will explore as a test suite are called synthetic tests, and metrics.
Metrics in datadog
We already mentioned metrics above, but I just wanted to share the insight that metrics can actually double as a test suite, but of a much more stochastic nature. A unit test is usually either failing or passing. You probably have some assertion at the end of the test that will produce a big red signal if the assertion fails. This is good for situations where you have clear success criteria, but not so much when these criteria are more ambiguous. We can kind of achieve something similar to a classical test by leveraging a metric. An example is probably illuminative here.
Consider a login system. You as an operator of this system probably have some intuition of how many customers you have, and how often they log in. Thus a reasonable metric would be number of logins over time. Thus your metrics would probably look something like this:
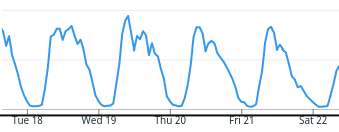
Logins over time
A quick glance at this graph and you will quickly learn the heartbeat of this system. You would probably come to expect most users to log in during the day, and less logins during the night. This is easily visualized using a metric and a graph in Datadog.
This way such a metric can act as a test. If you deploy something that completely changes the trends of your metrics, then you probably have a good reason to suspect that your commit broke something! This means that you actually now have some kind of coverage, even though you skimped on your classical tests. This of course depends on the system you are building, and what kind of SLAs you have promised to uphold. In the case of the login system, it might be embarrassing that your users can not log in, but it might not be the end of the world. A good metric would allow you to roll back your changes in minutes.
It should be emphasized that you have now gained some way to assess the correctness of your system without explicitly defining your success criterias by leveraging the human ability to recognize patterns. However, of course you should probably write some classical unit or integration tests. I’m just saying, when there is a lack of time, or when you can’t write them, this might be a decent replacement. Consult your SLAs however!
Synthetic tests
According to datadog ”Synthetic testing, also known as synthetic monitoring or proactive monitoring, is a way to identify performance issues with key user journeys and application endpoints before they degrade user experience.”
Their main focus on synthetic tests is to make sure that performance and availability is monitored, but they also note that ”Running synthetic tests within CI/CD pipelines lets these organizations remain agile while minimizing the risk of regressions.” Thus it would seem we can use synthetic tests to test functional requirements as well!
In your synthetic tests you can do both browser tests and HTTP tests. In the case of our hypothetical login system a browser test could be leveraged to do one of these logins with a robot user that we added to our system. Now these tests can be configured to run at certain intervals, or even triggered manually.
Thus, we now have a way to verify that a user can log in. Combining this with your metrics above, if both of these tests pass, you have a good chance that your system is working as intended. Withing reason of course, it all depends on how sophisticated your synthetic test is. But at least you will know that if this test fails, then something has to be investigated.
Conclusion
Datadog naturally has many more features that very likely could be used in the same way proposed here. However, these are two that I recently investigated in a project where it was hard to write proper integration tests, but where I wanted some way to make sure that the application worked as intended.
Moreover, we gained the benefit of truly decoupling the application from its tests. The only thing we interact with is the applications API which should be somewhat stable. Now we could throw out the entire tech stack, but keep our test suite. That is no lock in to something like Jest!
However, these techniques are probably not complete replacements for your classical tests. But if you find yourself in a situation where it is hard to test your dependencies, it might be better to use the techniques presented here than to skip testing all together. We all live in a time constrained world, and any way to help us make it more probable to write correct applications is worth its value in gold.

If you have any questions or want to discuss Datadog in general with me, feel free to contact me on teams or via email at christoffer.olsson@xenit.se
Datadog is the essential monitoring and security platform for cloud applications. We bring together end-to-end traces, metrics, and logs to make your applications, infrastructure, and third-party services entirely observable. These capabilities help businesses secure their systems, avoid downtime, and ensure customers are getting the best user experience. Read more about Datadog
Tags : Azure, Azure DevOps, datadog, DevOps, Security
Personlig rådgivning
Vi erbjuder personlig rådgivning med författaren för 1400 SEK per timme. Anmäl ditt intresse i här så återkommer vi så snart vi kan.

Add comment