Posted in : Citrix Av Gus Johansson Översätt med Google ⟶
5 years ago
Summary: Article describing how to extract data from Director and manipulating it in Excel for insights in your Citrix Enviroment.
Version of Director: 1906.1.0 Build 21
In the book From Control to Drift: The Dynamics of Corporate Information Infrastructures i was introduced to the term of transparency when it comes to infrastructure. The author expresses the idea of infrastructure being transparent for the user, because it does not need to implemented nor rebuilt for every task, it simply supports day-to-day tasks while being invisible (or not looked upon). When it does not support day-to-day tasks or malfunctions, it becomes very visible and in focus. In my opinion this is applicable for all form of infrastructures, as well as IT infrastructure. So this is where my blog post comes in, proactive measures to keep the servers going. Simply making sure you are in line with user behavior.
I recently got a case where we needed to identify login behaviors for a Citrix environment to make sure our infrastructure supports the amount of users at certain times. This leads to my first question:
How do you extract information from the Citrix environment?
I have more experience with Microsoft products than Citrix ones, so the first thing that came to my mind was the Citrix cmdlets for PowerShell. Set up a task that runs every 5 minutes and polls the Delivery Controller for x sessions and give that a time stamp.
I quickly realized I cannot be the only person who have stumbled upon the same issue, so I asked my colleague who is very experienced when it comes to Citrix environments in general. He quickly said, look in the Directory > Trends.
![]()
Under Trends we have heaps of tabs for numbers, values, insights and more.![]()
I was glad to see there was heaps of information to see. However, I was not able to on a detailed level see when user logged, on a day-to-day basis. This lead to my second question/s:
How many users are login in and at what times? What is the average of one week?
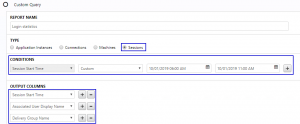
I quickly saw the ”Custom reports” tab and realized I had to export information to answer my questions. Within the Custom Reports you can easily extract the type of information you want. As can be seen below I have chosen to extract:
- Type: Sessions
- Conditions: Session Start Time (as I wanted to see when users logged on)
- Output columns:
- Session start time – timestamp on when the user logs on.
- Associated User Display Name – I realized fairly quick that this was not necessary – but its in there.
- Delivery Group Name – we have several delivery groups and I wanted to see the behavior per delivery group.
When exporting you get to download a .csv-file. This can be opened in Excel. The data is comma separated as shown below:
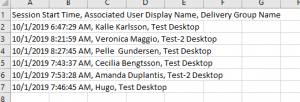
In order transfer the text to columns based on the commas. Press ”Text to columns”.

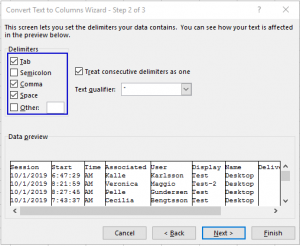
Make sure Delimited is chosen and press Next.

Tick the box for ”Comma”. You can see in the preview that the data looks correct. I chose ”Comma” and ”Space”. I wanted to make sure the date and time was separated as it means easier handling of the timestamp. Then press Next, then Finish.
The most important field for now is the timestamp. I am sure other people have solved the same problem in other ways but I use the power of Excel to make sense out of this.

In order to be able to draw conclusions to answer my questions and aid me in optimizing capacity I had to work some magic in Excel. Following are the functions and explanations of these:
- =MROUND – to be able to group up timestamps and make sense out of times we can round up timestamp. I choose to round up to closest 15 minutes. The round up function is within the Round up column, B2 is the timestamp we want to round up and the cell contained this:
=MROUND(B2; 15 / (60 *24))
This results in:
Start Round up 06:17:22 06:15:00 06:34:55 06:30:00 06:59:22 07:00:00 06:06:20 06:00:00 06:07:13 06:00:00 06:22:03 06:15:00 - =COUNTIF – now when we have grouped timestamps into quarters. We would like to count the quarters. This is easily done with =COUNTIF. Which basically counts the value if it meets the criteria. In the Time column below I have just written the quarter timestamps I want to group timestamps in. In the Number column I have the COUNTIF-function.
=COUNTIF($C$2:$C$7;E2)
Data: Number of concurrent sessions per time Start Round up Time: Number: 06:17:22 06:15:00 06:00 1 06:34:55 06:30:00 06:15 2 06:59:22 07:00:00 06:30 1 06:45:20 06:45:00 06:45 1 06:07:13 06:00:00 07:00 1 06:22:03 06:15:00 07:15 0
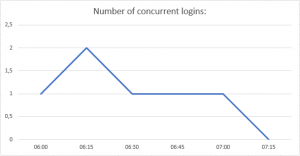
We now have data that we can make sense out of. We can now use a linear graph to present the data. We can see that most people (two) login at 06:15 and by 07:15 my five users have logged on.
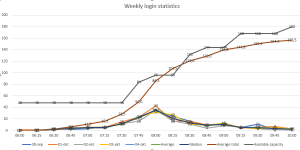
My example lack the quantity that might be exciting and fun to see. I will therefore include a graph below from a case where we are analyzing login behavior to optimize the amount of session hosts able to receive a session. As we can see below I have some lines in the graph:
- Per day insight – with this I am able to see login behavior for each day. We can clearly see that we have logon peaks at around 08.00 AM.
- Average/Median for the week – with this we can get a better understanding of the average/median login behavior of the week
- Average total – with this I am able to see the total amount of users login in for every quarter. Our session hosts must be able to handle this amount of users.
- Available capacity – as we are scaling our session hosts, the available capacity must be able to meet the logins of the users. We can clearly see that, at around 08:15 we are currently not.
Thank you for reading and I hope you have learnt something from this. I am sure there are other ways of achieving the same goal, please do not hesitate to paste a link to your blog post or describe how you do it. Let us learn together!
Best regards,
Gus Johansson
Tags : #Excel, behavior, Citrix, director, login, statistics, user
Personlig rådgivning
Vi erbjuder personlig rådgivning med författaren för 1400 SEK per timme. Anmäl ditt intresse i här så återkommer vi så snart vi kan.


Add comment