Posted in : NetScaler, Other Av Rasmus Kindberg Översätt med Google ⟶
6 years ago
Over the last couple of years of working with the Citrix Netscaler product I’ve been noting down Netscaler cmds that I’ve found useful in various scenarios. The list of cmds I have saved up is quite big now, and I figured it would be helpful for other Netscaler admins to know about some of these.
Show amount of RAM that Netscaler Integrated Caching is currently using:
When configuring Integrated Caching on Netscaler you usually specify a max amount of RAM available for caching, and then create ContentGroups that dynamically increase (although with a RAM MB cap set for each ContentGroup) their RAM usage as the amount of cached objects will increase (assuming you use dynamically sized ContentGroups). You can also run below command without the ’grep -i’ part to see other useful info regarding cache stats.
stat cache -detail | grep -i "Utilized memory"
![]()
Show cached http objects (Netscaler Integrated Caching):
show cache object | grep -i "ICCG-MYCONTENTGROUP"
The ’show cache object’ will simply list all cached objects on Netscaler, and you can then use ’grep -i’ to only list the rows for objects cached in the ContentGroup ’ICCG-MYCONTENTGROUP’.
The output looks like below:
0x000000000bca00000509 ICCG-MYCONTENTGROUP GET //www.mysite.com:443/resources/instagram/js/insta.v2.js
0x00000000468200000238 ICCG-MYCONTENTGROUP GET //www.mysite.com:443/assets/computer.gif
0x0000000063cb00012c54 ICCG-MYCONTENTGROUP GET //www.mysite.com:443/assets/Img/car.jpg
0x00000000a417000003b0 ICCG-MYCONTENTGROUP GET //www.mysite.com:443/Archive/plumber.gif
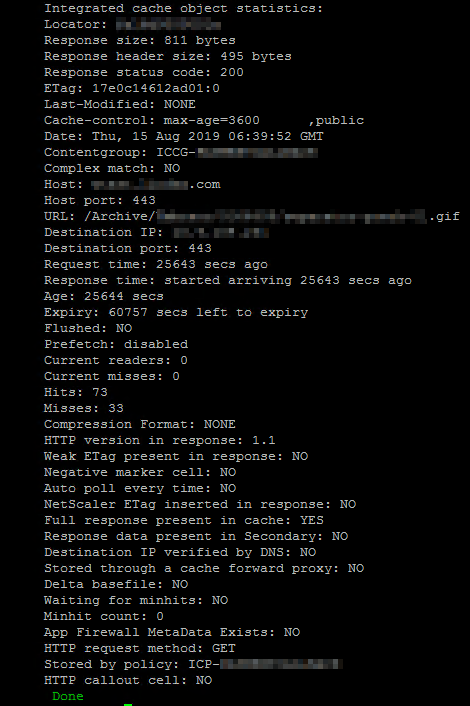
You can then run below cmd to list particular properties about one of the cached objects:
show cache object -locator 0x0000000046820000023
Some useful info here is the ’Hits’ and ’Misses’ for this particular Cached object, to see how much this particular cache object is being utilized and if the cache expiration timer should be increased/decreased for this cached object.
See LDAP authentication log output:
shell
cat /tmp/aaad.debug
Run above and then perform an LDAP logon. You will then be able to see the LDAP authentication process logs in real-time, which includes info about any AD groups extracted from the user or the reason why LDAP authentication is failing for a particular user, among other things.
See Kerberos authentication log output:
Similar to above LDAP command, there is also a log file for reading real-time info regarding Kerberos authentication. However, starting with Netscaler 12.1 (I believe), this log file will only display info the first time a particular user performs Kerberos authentication (and assuming it succeeds). If you need to troubleshoot the Kerberos auth when you or another user authenticates, then you will most likely need to delete all current Kerberos tickets on Netscaler or the log file won’t output anything. You can do this with below command ”nsapimgr_wr…”. The consequence of deleting stored Tickets is that Netscaler will need to perform Kerberos auth anew the next time a user logs on to Netscaler, but this won’t have any real impact on either Netscaler CPU/RAM usage or the user experience (as long as the Kerberos authentication is still working!).
shell
nsapimgr_wr.sh -ys call=ns_aaa_flush_kerberos_tickets
cat /tmp/nskrb.debug
Check if network packets have been dropped due to Netscaler bandwidth limit being capped out:
If you have a Netscaler VPX with let’s say a 1000 Mbps bandwidth limit (due to Netscaler license), then any packets sent to Netscaler will be dropped if the current bandwidth throughput on Netscaler is already at 1000 Mbps. If below command doesn’t show any output then there have been no packet drops due to bandwidth cap recently.
shell
nsconmsg -K /var/nslog/newnslog -g nic_err_rl -d current -s disptime=1 | more
List all Netscaler Monitors that are currently marked as DOWN, and the reason why:
shell
nsconmsg -K /var/nslog/newnslog -d event | grep -i "DOWN;"

Check if there are any Netscaler HA packets that are not getting through to either Netscaler node:
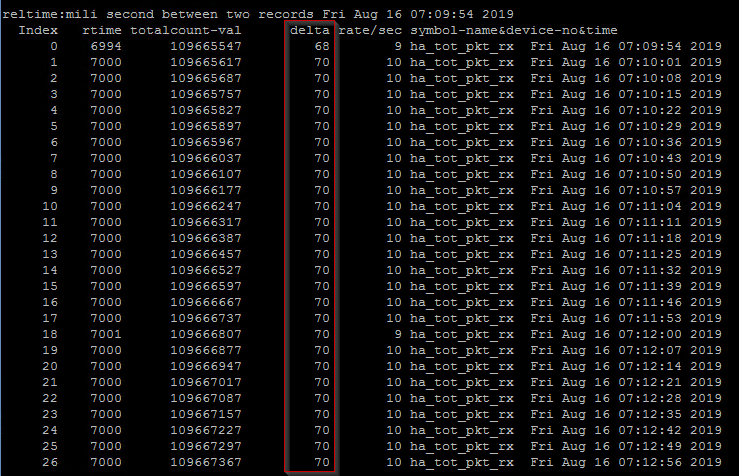
Below command will list the latest HA packets received to this particular Netscaler node. The column ’delta’ is the one we’re interested in, and as we can see below we’re seeing a quite consistent value of ’70’ or around that for all HA packets. If we see one or a few lines with lower delta values (less than ’60’) then that might indicate a network issue between the two netscaler nodes.
shell
nsconmsg -K /var/nslog/newnslog -s disptime=1 -d current -g ha_tot_pkt_rx | more
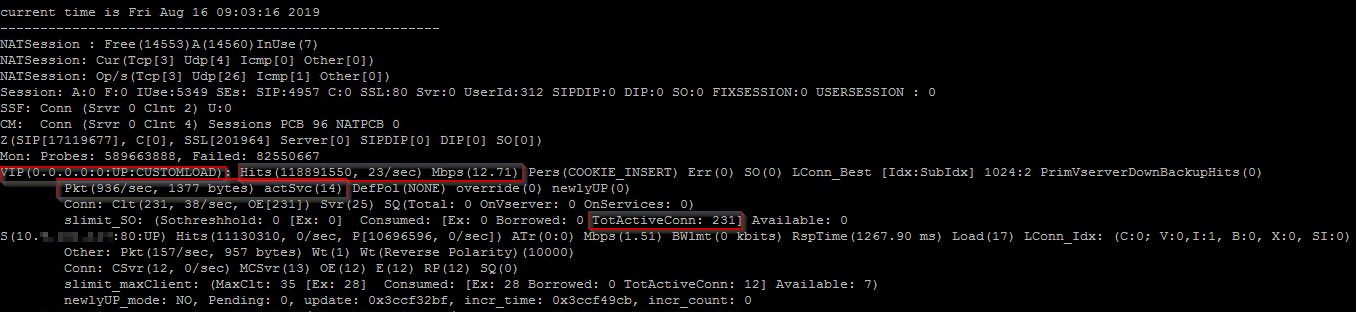
Show summarized network statistics for a specific LB vServer:
I mainly use this command to show the current ’Mbps’ value of traffic going through a particular LB vServer. A more user-friendly output of similar info (except for the mbps value) is ”stat lb vserver LB-SOMEAPP -full”
shell
nsconmsg -K /var/nslog/newnslog -j "LB-SOMEAPP" -T 7 -s ConLb=2 -d oldconmsg | more
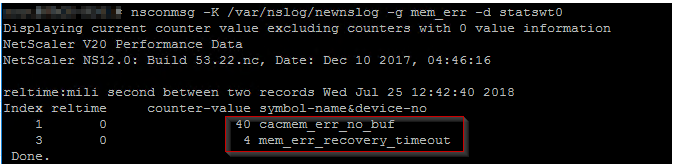
Check if there are any logged errors regarding memory (RAM) allocation:
There have been some Netscaler versions released that have contained memory leaks or RAM issues, and below command will show if there have been any RAM allocation failures (among other RAM errors). If there are no issues then you will get an empty output.
shell
nsconmsg -K /var/nslog/newnslog -d current -g mem_err -d statswt0
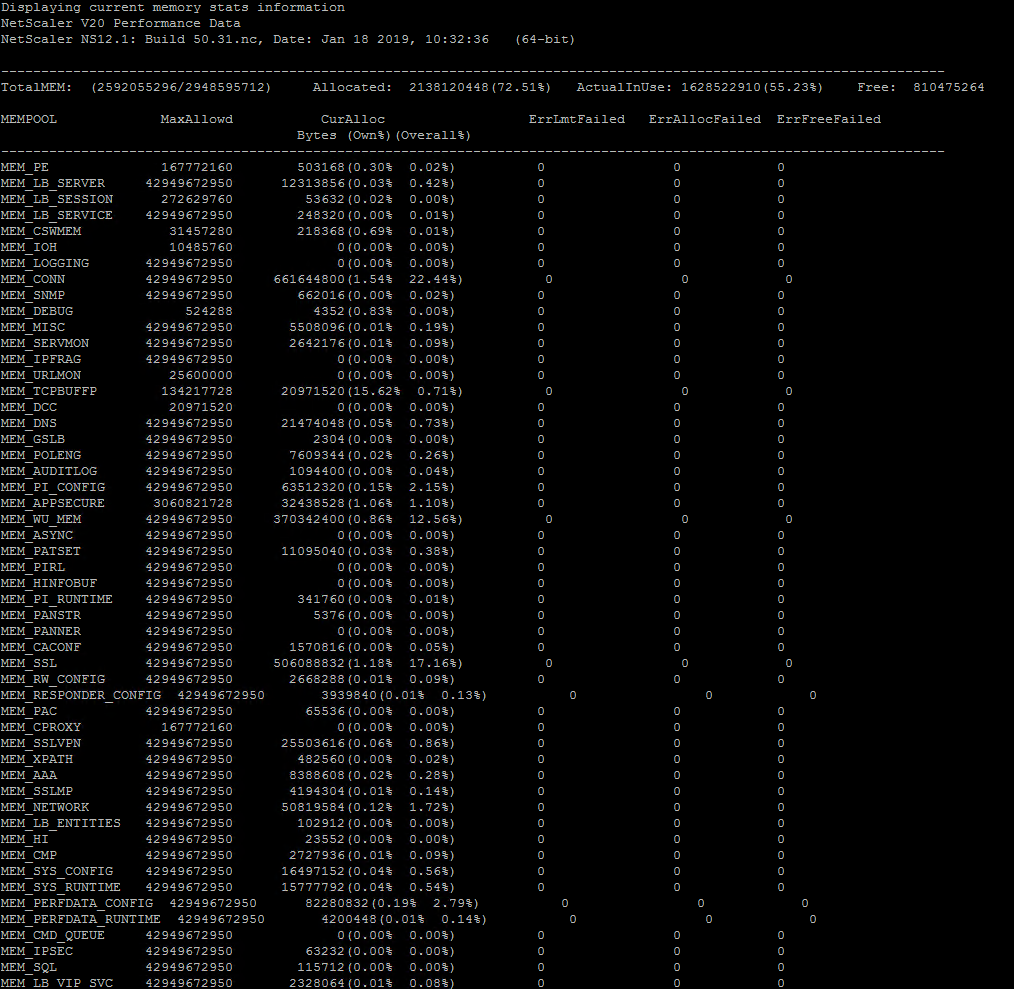
See total summary of RAM allocation to different Netscaler modules (and any potential memory errors):
Below can be useful if you see sudden spikes in RAM usage on a Netscaler, and you want to see what particular Netscaler module that caused/is causing it. You can then run below, take a screenshot and then run it again at a later time (when RAM usage% on Netscaler is differnet) and what module has changed its ram usage%.
shell
nsconmsg -d memstats | more
Read Netscaler log file ns.log in real-time with filter:
Below can be useful if you’re troubleshooting a particular issue and want to see if Netscaler is logging anything relevant to ns.log while you perform user operation X. ’tail’ will print new entries in ns.log directly into your SSH window, and the ’grep -i’ will limit which messages you see. In below example I filter for any lines containing ’snmp’.
shell
tail -f /var/log/ns.log | grep -i "snmp"

Check if Netscaler has detected any IP conflicts on a subnet used by Netscaler:
Below is useful if you notice network issues, you suspect there is an IP conflict on network (a random, unassociated backend-server has same IP as a LB vServer on Netscaler, for example) or if https://cis.citrix.com diagnostics is reporting an IP conflict. I don’t have an example of output, but if it is empty then there has been no detected conflict recently.
shell
nsconmsg -K newnslog -d consmsg | grep -i conflict
Reading old newnslog log files:
When you perform any ’nsconmsg -K newnslog’ command, it will only go through historical events for the last X hours/days (if your Netscaler is logging alot of data, then it’s probably a matter of hours instead of days of historical data). To check for events/issued in the past or for a particular date, you need to unzip old nsconmsg files and read from them instead. See https://support.citrix.com/article/CTX113341 on how to specify a specific time period within a newnslog file to look at.
Run below to unzip old files and check for particular events in these log files:
cd /var/nslog
ls -l
tar xvfz newnslog.99.tar.gz
nsconmsg -K /var/nslog/newnslog.99 -s ConMEM=2 -d oldconmsg | more
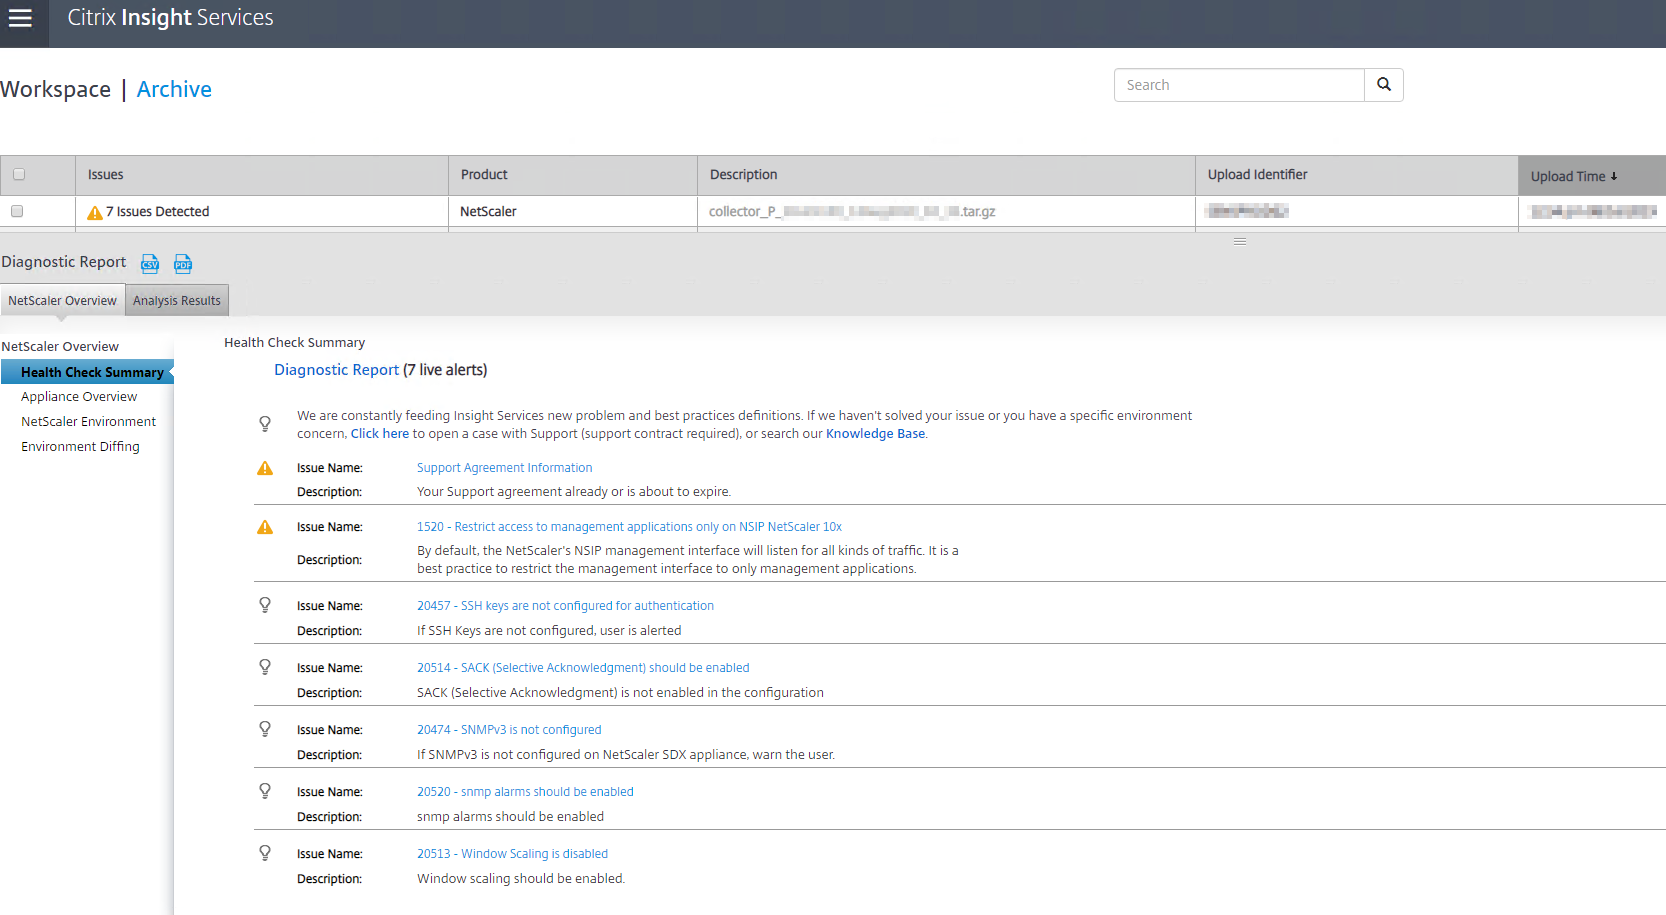
Utilizing https://cis.citrix.com to analyze Netscaler logs to automatically detect issues:
Below is useful if you do weekly/monthly/quarterly health checks on a Netscaler, since uploading Netscaler log files to https://cis.citrix.com will catch alot of issues (although not everything listed above in this blog post) and also give recommendations on configuration changes if something is not according to Citrix’s Best Practices.
show techsupport (this command will generate a .tar.gz archive file on Netscaler in folder /var/tmp/support/ called 'collector_P_IPADDRESS_DATETIME.tar.gz')
Now you can proceed to download the .tar.gz file from Netscaler (using WinSCP for example) and manually upload it to https://cis.citrix.com. After upload it will take 5-15 minutes for Citrix’s analysis tool to go through the log files and generate list of recommendations and detected issues.
You can also run below command with ’-upload’ parameter to instruct Netscaler to automatically upload the log files to https://cis.citrix.com for analysis, so you don’t have to do that manually. The username/password you specify here are the credentials you use to logon to https://cis.citrix.com. You could possibly automate this process by having a script logon to Netscaler through SSH and run below command, but there doesn’t seem to be a way to automatically send reports or output from https://cis.training.com once the analysis is complete. Perhaps Citrix will add this functionality in the future.
show techsupport -upload -username MyUsername -password MyPassword123
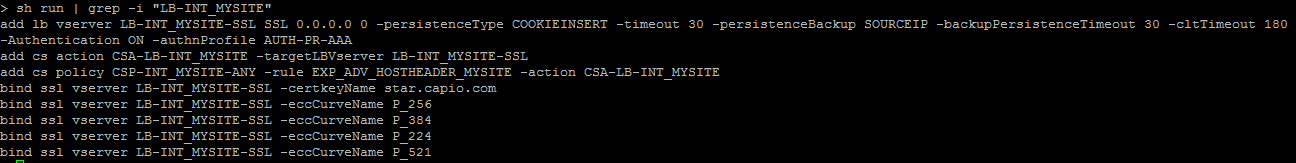
Showing the CLI configuration for a particular Netscaler object:
At Xenit we have a separate document for each Netscaler environment we manage, and this document always contains the latest ns.conf configuration. Whenver a change is done on a Netscaler, the configuration document is updated by the consultant with the new changes. For some Netscaler change tasks you might want to perform them in the Netscaler admin GUI, and not through CLI, and you can then afterwards run below command to show all lines in ns.conf containing the string ’LB-MYAPP’. Now it’s simply a matter of copy pasting the output into the configuration document.
sh run | grep -i "LB-MYAPP"
Example:
If you have any questions or input to above, feel free to either leave a comment here on the blog or email me at rasmus.kindberg@xenit.se.
Other useful material/links for Netscaler commands/CLI/troubleshooting:
https://support.citrix.com/article/CTX231777
https://support.citrix.com/article/CTX113341
http://www.it-solved.nl/app/uploads/NetScaler-CLI-Troubleshooting-Cheat-Sheet.pdf
Personlig rådgivning
Vi erbjuder personlig rådgivning med författaren för 1400 SEK per timme. Anmäl ditt intresse i här så återkommer vi så snart vi kan.

Add comment