Posted in : Applications, Microsoft Av Robert Skyllberg Översätt med Google ⟶
7 years ago
Recently I stumbled over a great application for debugging your system while trying to examine a memory dump. The application is named WinDbg Preview and is distributed by Microsoft themselves and serves several purposes for debugging Windows operating systems.
WinDbg Preview is a modernized version of WinDbg and extremely easy to use! With WinDbg Preview you can for example do the following:
- Debug executables
- Debug dump and trace files
- Debug app packages
- Debug scripts
WinDbg Preview
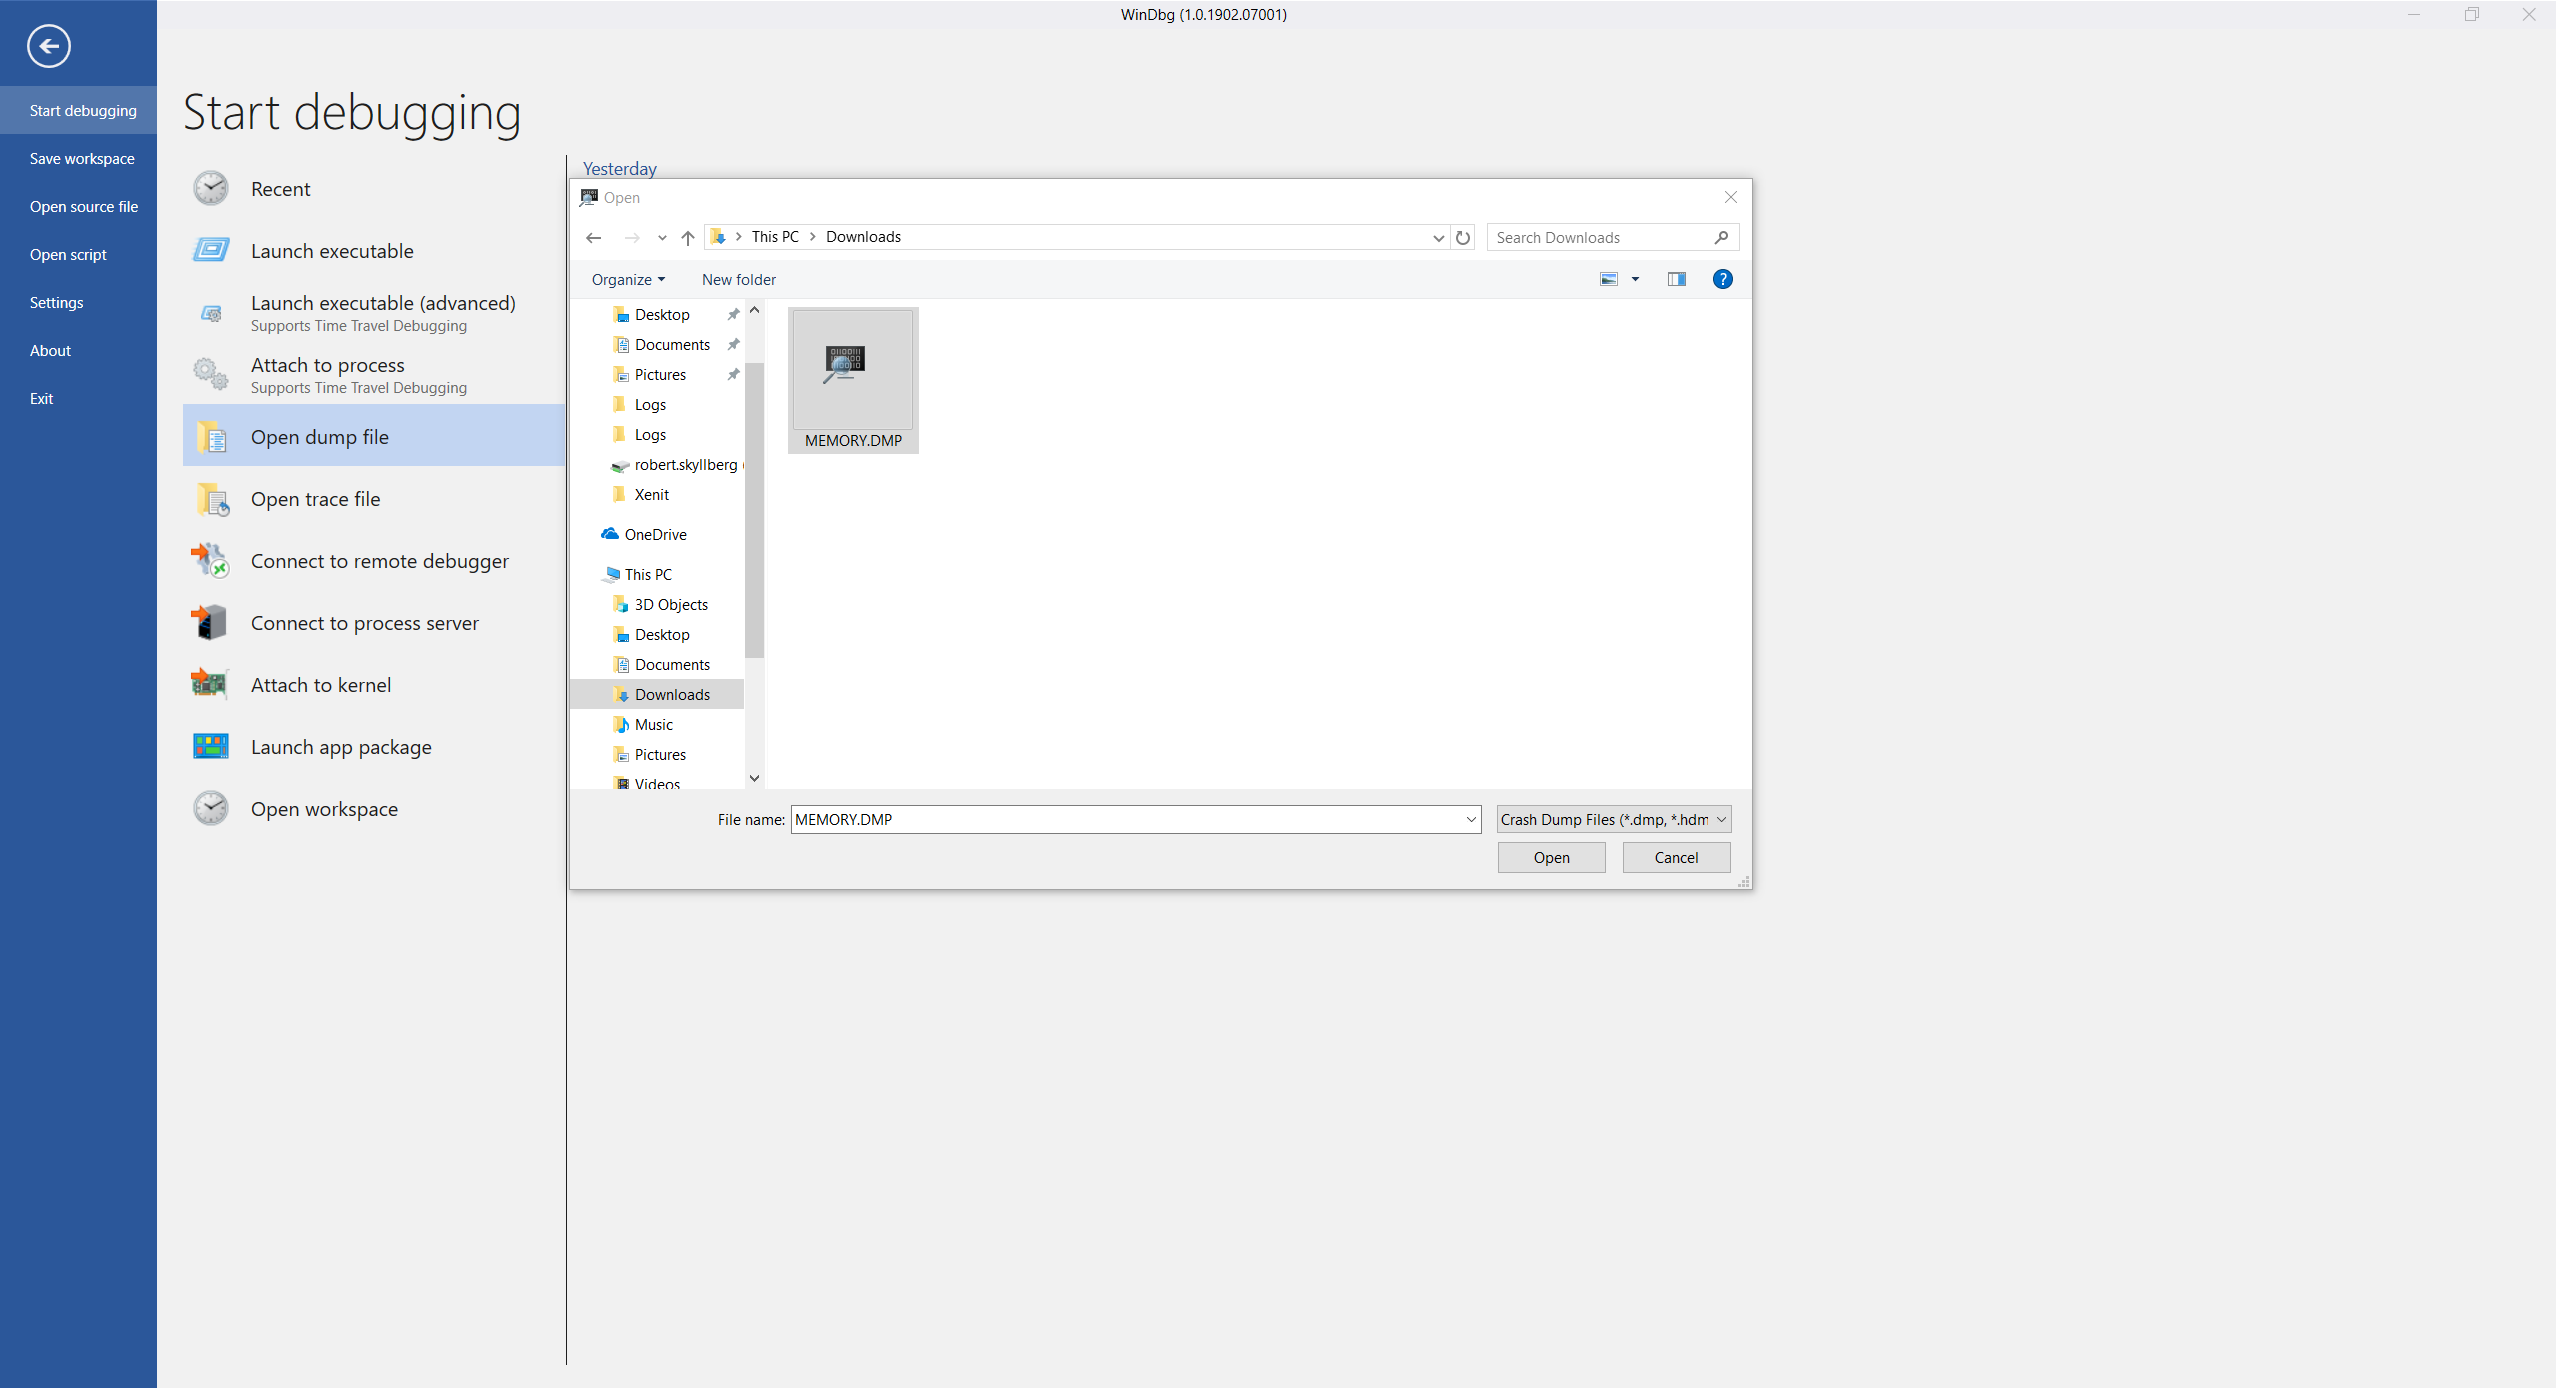
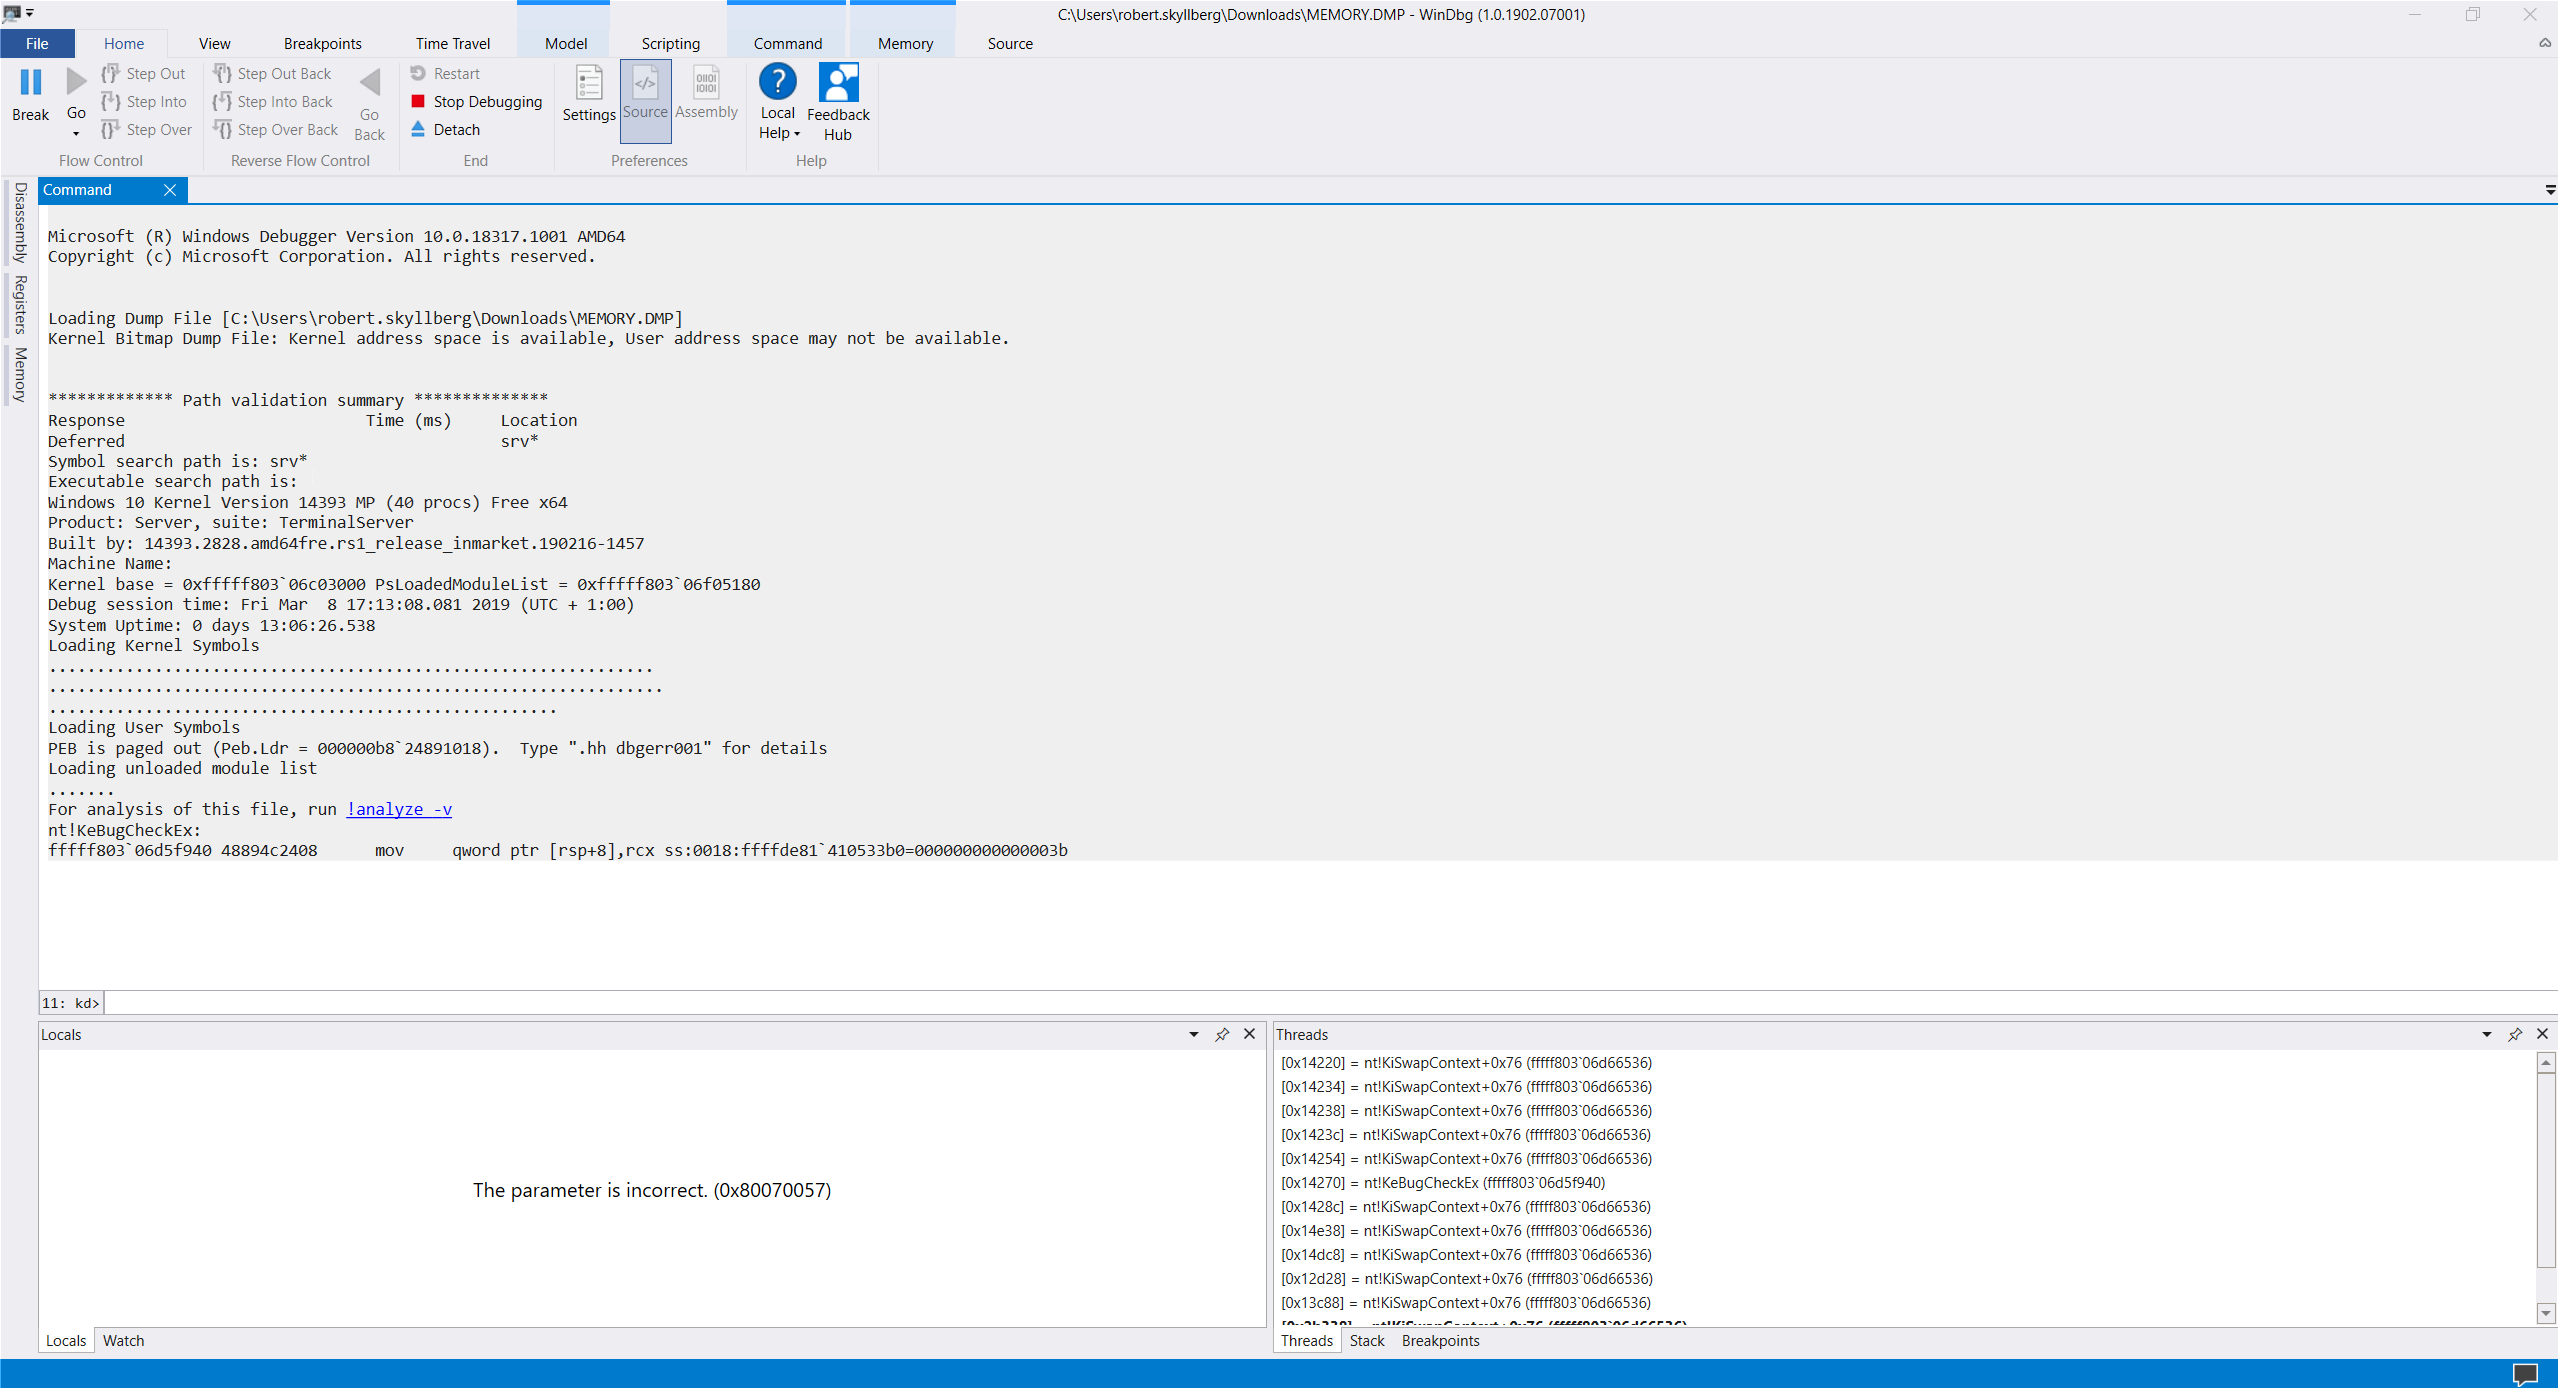
In my use case I wanted to quickly analyse a memory dump file which had been generated. A minute and about five clicks later I had received an analysis which gave me all the information I needed. I was also told which commands to use on the go without thinking.
Attaching memory dump file

Analysis result
WinDbg Preview is available from the Windows Store and can be read more about it here.
If you have any questions, feel free to email me at robert.skyllberg@xenit.se or comment down below.
Tags : Debug, Microsoft, WinDbg, Windows 10
Personlig rådgivning
Vi erbjuder personlig rådgivning med författaren för 1400 SEK per timme. Anmäl ditt intresse i här så återkommer vi så snart vi kan.

Add comment